
1. Comfort Dilemma
Heatwaves that once made headlines are becoming a regular feature of summer in many parts of the world. In the Northern Hemisphere, demand for air conditioning (AC) is spreading northward while continuing to grow in the south. For older people, patients and others exposed to dangerously hot conditions, cooling is not simply a luxury. Yet air conditioners consume electricity and use refrigerants that may be potent greenhouse gases, so cooling is often presented as a technology that worsens the problem it is meant to solve. With global space-cooling demand projected to grow strongly, this concern deserves measurement rather than rhetoric [1].
The useful question is not whether an air-conditioner emits greenhouse gases. It does. The question is how much global warming those emissions actually produce, when that warming occurs, and which practical choices reduce it most. Here we answer that question for one European residential split unit and for a stylised European fleet from 2026 to 2050 using a new metric: life cycle temperature response (LCTR).
2. From GWP to Temperature Response
Global Warming Potential is indispensable for regulation and inventories, but it combines a gas’s behaviour over a fixed horizon into one CO₂-equivalent number. That makes it difficult to see the difference between a relatively short-lived refrigerant pulse and CO₂ from electricity, which persists much longer. It also does not directly answer the most intuitive question: how much warmer is the world in a particular year?
The LCTR addresses this question. For each life-cycle emission, the gas, mass and year are recorded, and then the pulse is multiplied by its Absolute Global Temperature-change Potential (AGTP) for the remaining time to a chosen target year. AGTP is the IPCC’s representation of the temperature change following an emission as an impulse response [2]. Adding the responses from manufacturing, operation, and end-of-life handling gives the total warming contribution in the target year. The results are expressed in picokelvin (pK, 10⁻¹² K) for a single unit, and in millikelvin (mK, 10⁻³ K) for a fleet.
Figure 1 illustrates the process for an R32 unit installed in 2026 and retired in 2041. First, manufacturing CO₂ and refrigerant production occur; then, during service, annual electricity, ordinary leakage and the manufacture of replacement refrigerant follow; finally, in the retirement year, ordinary operation plus the unrecovered-charge release, equipment recycling and treatment of the recovered charge occur. As each R32 or CO₂ pulse follows its own AGTP curve, the total warming rises and later decays, rather than ending when the equipment is scrapped. Reading the curve in 2050 yields the LCTR.
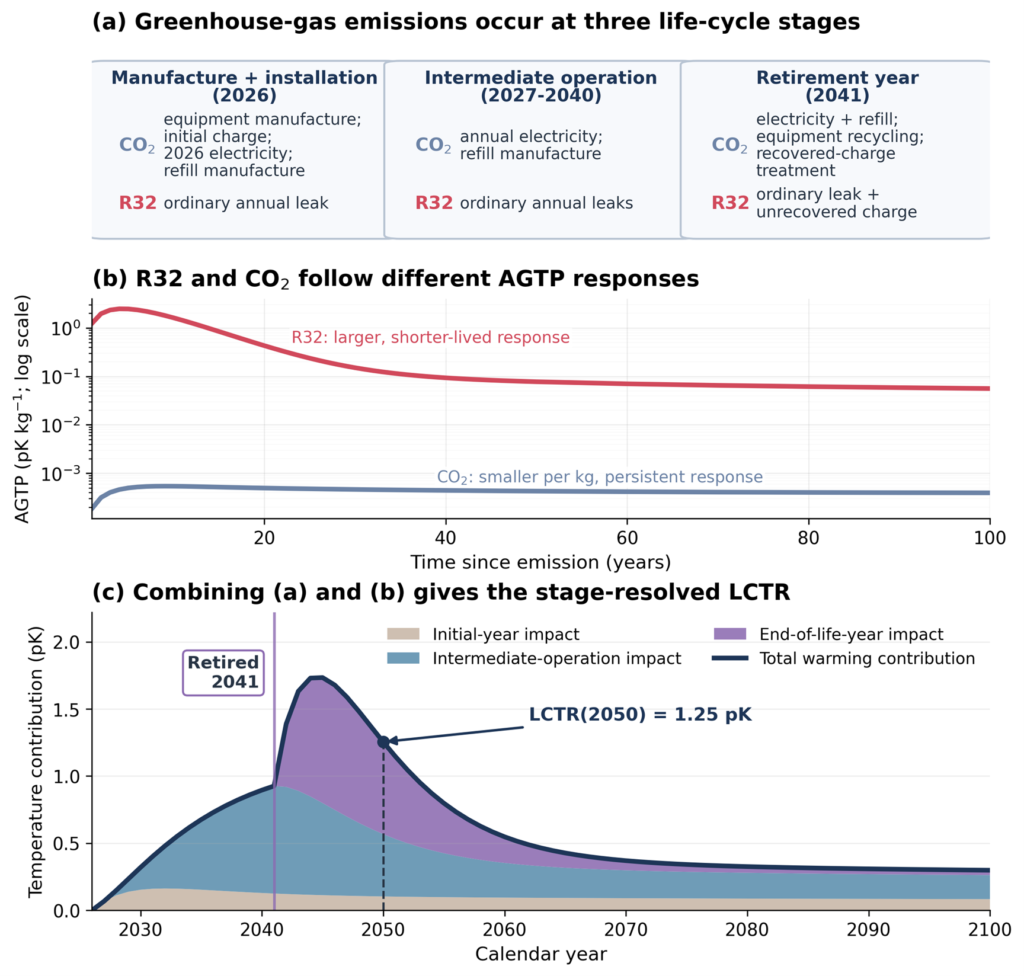
Figure 1. How LCTR converts a timed life cycle into a target-year temperature contribution, illustrated for a 3.5 kW R32 split unit installed in 2026, retired in 2041, operated under the regulated-baseline assumptions and a synthetic European climate. (a) CO₂ and R32 emissions occur during manufacture and installation, intermediate operation and the retirement year; 2041 includes ordinary leakage plus release of the unrecovered charge, while recovered refrigerant is treated. (b) AR6-based AGTP functions assign different time responses to each kilogram of R32 and CO₂. (c) Combining the dated emissions with their gas-specific AGTP functions gives the stage-resolved warming through 2100; their sum in 2050 is LCTR = 1.25 pK.
3. What Does One Air Conditioner Add?
The representative unit is a 3.5 kW residential split system installed in 2026, used for 15 elapsed years and retired in 2041. The 2050 comparison holds capacity, lifetime, climate, leakage, recovery and grid pathway constant while changing only the refrigerant and associated performance data. For the R32 version, the corrected LCTR is 1.254 pK. Refrigerant release contributes 0.951 pK (75.8%), electricity contributes 0.220 pK, and embodied and service-related CO₂ contributes 0.083 pK. The last term includes equipment and initial-charge manufacture, production of replacement refrigerant, recycling, and treatment of the recovered charge.
Refrigerant choice changes where the warming comes from (Figure 2). Under the same conditions, an R410A unit reaches 2.290 pK, an R454C unit 0.530 pK, and an R290 unit 0.291 pK. Moving from legacy R410A to propane therefore reduces the 2050 LCTR by a factor of 7.9. The direct warming contribution from propane is almost invisible, leaving electricity and embodied emissions as the residual. This is consistent with the very low GWP100 value assigned to R290 in the EU’s implementation information, whereas the restrictions for small split air-to-air systems tighten from GWP 150 in 2029 to fluorinated-gas prohibition in 2035, subject to safety exceptions [3,4].
“European” here does not mean one particular city. The central result uses a synthetic stock-weighted climate: 60% of the mean cooling-temperature distribution for eight southern cities and 40% of the mean for six central cities, built from JRC PVGIS typical meteorological years [5]. A city-level sensitivity check for the same R32 unit gives 1.05 pK in Munich and 1.81 pK in Seville, with the synthetic European value between them. The regional difference is mainly electricity use; the refrigerant and embodied terms are unchanged. The per-unit result is therefore representative of a defined European mix, not a universal value for every location.
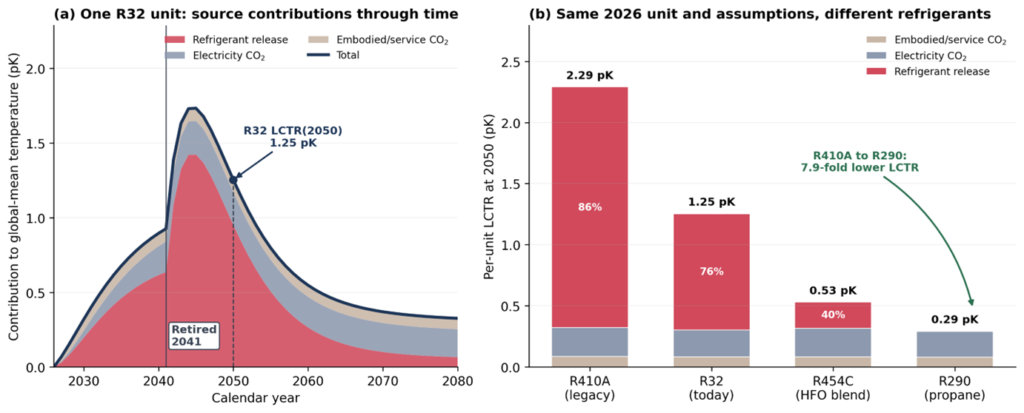
Figure 2. Source attribution of per-unit LCTR under common conditions: a 3.5 kW split unit installed in 2026, retired in 2041, regulated-baseline assumptions, synthetic European climate and 2050 target year. (a) The R32 case separates refrigerant release, electricity CO₂ and embodied/service CO₂ through 2080. (b) The corrected 2050 totals are 2.29 pK for R410A, 1.25 pK for R32, 0.53 pK for R454C and 0.29 pK for R290; percentages inside the bars are the refrigerant shares.
4. Three European Cooling Futures
One pK is negligible; millions of units make the policy question visible. We therefore model an existing stock of 110 million residential split units and annual new sales from 2026 to 2050. The fleet stock and sales paths are scenario inputs, chosen to compare internally consistent futures rather than to predict the market. Existing units retire after 15 elapsed years, while new units enter with the refrigerant allowed by each scenario. Annual new sales rise from 8 to 16 million units in A and from 9 to 24 million in B and C; cumulative 2026-2050 new sales are therefore 300 million in A and 412.5 million in B and C. Grid intensity starts near the current EU level and then follows a fast, medium or stalled decline; the EEA documents both the continuing EU decline and large differences among Member States [6].
In the Regulated Baseline (A), new units use R32 through 2028, R454C from 2029 to 2034 and R290 from 2035; annual leakage is 3.5%, end-of-life recovery is 50%, and the grid decarbonises at a medium pace. Its 2050 fleet LCTR is 0.185 mK.
In the Green Frontrunner (B), new sales move to R290 from 2027, annual leakage falls to 2%, recovery rises to 80%, efficiency improves and the grid decarbonises rapidly. B therefore has 37.5% more cumulative new sales than A, yet its 2050 LCTR is only 0.090 mK.
In the Fossil Laggard (C), the refrigerant schedule is the same minimum-compliance path as A; it is not an exemption-based extension of high-GWP refrigerants. The difference is poorer practice: 5.5% annual leakage, only 20% recovery, and a grid that remains more carbon-intensive. With the same high uptake as B, its 2050 LCTR reaches 0.308 mK.
Zhang et al. [7] provide a useful check on the scale of these results. For global residential and commercial air-conditioning under SSP2-4.5, they estimate 113.3 GtCO₂e of cumulative emissions during 2010-2050 and an additional 0.05°C of warming in 2050 (range 0.03-0.07°C). Our sub-mK estimates cover only European residential split systems and emissions accounted after 2026, so the two studies are consistent in scale but are not directly comparable.
Our three European values are tiny beside approximately 2°C of mid-century warming under an intermediate global pathway [2]: 0.0045%, 0.0093% and 0.0154%, respectively. European residential cooling is therefore makes only a very small contribution to mid-century warming. But the C-B spread is 0.218 mK, larger than the whole Green Frontrunner footprint. Converting that spread to the mass of CO₂ that produces the same temperature response in 2050 gives about 446 Mt. This is a target-year temperature-equivalent comparison, not conventional cumulative CO₂e. Using the selected EDGAR 2023 fossil-CO₂ benchmark, it is about 7.3 times Austria’s annual emissions [8].
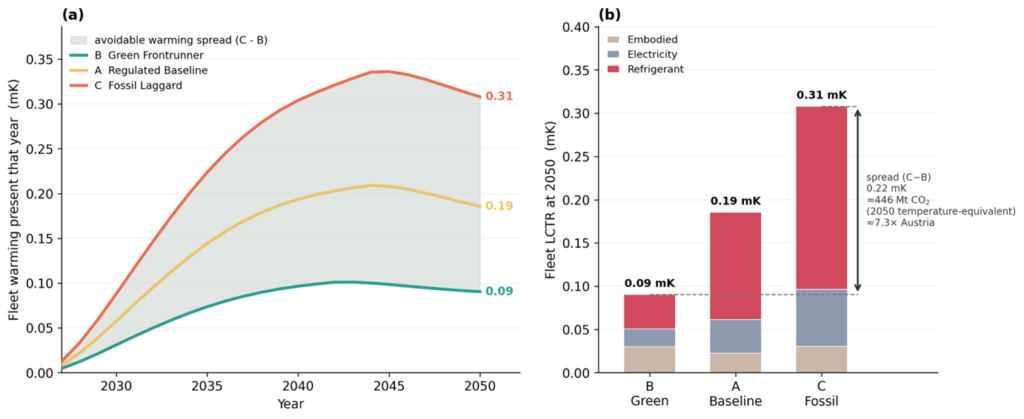
Figure 3. European residential split-air-conditioning fleet warming from emissions accounted after 2026. (a) Warming present in each evaluation year under the Green Frontrunner (B), Regulated Baseline (A) and Fossil Laggard (C); shading marks the avoidable C-B spread. (b) Refrigerant, electricity and embodied/service contributions in 2050 total 0.090, 0.185 and 0.308 mK. The 0.218 mK C-B spread is about 446 Mt of CO₂ on a 2050 temperature-equivalent basis, or 7.3 times Austria’s selected 2023 annual fossil-CO₂ benchmark.
5. What Do the Numbers Ask of Policy?
The first priority is a genuinely low-impact refrigerant, deployed as soon as safety rules, product design and installer competence allow. For small split systems, the EU timetable already points strongly toward that outcome [3,4]. HFO blends can reduce direct warming during the transition, but climate performance is not their only environmental dimension. HFO-1234yf, a component of R454C, forms trifluoroacetic acid in the atmosphere, and both the scientific literature and the evolving European PFAS process justify continued scrutiny rather than assuming that low GWP settles every question [9,10]. R290 is therefore especially important for small residential split systems and is already a practical option where charge limits, product design and installer competence allow it to be used safely [3,4].
The second priority is end-of-life handling. The unrecovered fraction is a direct release; the recovered fraction is the amount sent for treatment. Better recovery therefore reduces the largest single refrigerant pulse. Preventing service leaks also avoids both the direct emission and the manufacturing footprint of replacement refrigerant.
The third priority is electricity decarbonisation. As direct refrigerant warming approaches zero, efficiency, passive cooling, sensible setpoints and grid decarbonisation dominate what remains. The conclusion is not that Europe should deny cooling. It is that access and climate protection can be aligned: use the lowest-impact refrigerant that can be applied safely, keep it inside the system, recover it at retirement, and reduce the carbon behind the plug.
References
1. International Energy Agency (2018). The Future of Cooling: Opportunities for Energy-Efficient Air Conditioning. https://www.iea.org/reports/the-future-of-cooling
2. IPCC (2021). Climate Change 2021: The Physical Science Basis, Chapter 7 and Supplementary Material, Table 7.SM.7. Cambridge University Press. https://www.ipcc.ch/report/ar6/wg1/
3. European Union (2024). Regulation (EU) 2024/573 on fluorinated greenhouse gases. Official Journal of the European Union. https://eur-lex.europa.eu/eli/reg/2024/573/oj
4. European Commission (2025). Air conditioning: climate-friendly alternatives to F-gases. https://climate.ec.europa.eu/eu-action/fluorinated-greenhouse-gases/climate-friendly-alternatives-f-gases/air-conditioning_en
5. European Commission, Joint Research Centre. PVGIS 5.2 Typical Meteorological Year generator. https://joint-research-centre.ec.europa.eu/photovoltaic-geographical-information-system-pvgis/using-pvgis-5/pvgis-5-tools/pvgis-typical-meteorological-year-tmy-generator_en
6. European Environment Agency (2026). Greenhouse gas emission intensity of electricity generation in Europe. https://www.eea.europa.eu/en/analysis/indicators/greenhouse-gas-emission-intensity-of-1/
7. Zhang, H. et al. (2026). Rising Air-Conditioning Use Intensifies Global Warming. Nature Communications, 17, 1961. https://doi.org/10.1038/s41467-026-69393-1
8. Crippa, M. et al. (2024). GHG Emissions of All World Countries: 2024 Report. Publications Office of the European Union, JRC138862. https://publications.jrc.ec.europa.eu/repository/handle/JRC138862
9. European Chemicals Agency. Per- and polyfluoroalkyl substances (PFAS): restriction process and updates. https://echa.europa.eu/hot-topics/perfluoroalkyl-chemicals-pfas
10. Xia, S. et al. (2021). Trifluoroacetic acid deposition from emissions of HFO-1234yf in India, China, and the Middle East. Atmospheric Chemistry and Physics, 21, 14833-14849. https://doi.org/10.5194/acp-21-14833-2021

Xianting Li

Xiaoyan Li

Baolong Wang

Shuwen Shang

Qinsong Zhang